Logo American Journal of Case Reports

Call: 1.631.629.4328
Mon-Fri 10 am - 2 pm EST

Contact Us

Logo American Journal of Case Reports Logo American Journal of Case Reports Logo American Journal of Case Reports

14 October 2020: Articles  Netherlands

Limitations of Dutch Growth Research Foundation Commercial Software Weight Velocity for Age Standard Deviation Score

Rare disease

Martin J.C. Van Gemert1ABCDEF*, Marianne Vlaming2ABDEF, Bülent Köseoğlu3ABCD, Cornelis M.A. Bruijninckx4ABCDE, Ton G. Van Leeuwen1ACDE, Martino H.A. Neumann5ACDEF, Pieter J.J. Sauer6ABCDE

DOI: 10.12659/AJCR.925551

Am J Case Rep 2020; 21:e925551

0 Comments

Abstract

BACKGROUND: The commercial software for hospitals, Weight Velocity for Age Standard Deviation Score (SDSWVA), claims to document the growth and development of children, although published details are unavailable. The statistics-derived parameter SDSWVA includes the weight velocity at age t, WV(t) (weight gained between t and (t–1.23) years, divided by 1.23), and 3 standard weight velocity curves at average age AA, defined as AA=t–1.23/2 years. SDSWVA denotes the number of standard deviations that WV(t) deviates from the 0 SD weight velocity at AA. WV(t) yielded erroneous outcomes when applied to weights of a seriously underweight boy with an allergy to cows’ milk who showed strong weight growth after being fed on food free of cows’ milk. The SDSWVA software tacitly suggests that it is more accurate than WV(t).

CASE REPORT: The case of this boy was previously described in this Journal. Using SDSWVA(t,AA) software, his weight growth was analyzed by his third pediatrician, beginning at age 1.5 years. The diagnosis of the mother with Pediatric Condition Falsification was confirmed, adding 6 months to foster care, which totalled 8.5 months. Testing of the SDSWVA software on the boy’s weight curve yielded results that were complex, nontransparent, and as erroneous as WV(t), explaining the misdiagnosis by the third pediatrician.

CONCLUSIONS: SDSWVA software should not be used for children under 3 years and during variable weight behavior. Erroneous performance, unpublished details, and an error identified in their new but untested software make the Dutch Growth Research Foundation unlikely to meet the 2020 European Union regulations for in vitro medical devices.

Keywords: Body Weight Changes, case reports, Diagnostic Errors, Software, Child, Child, Preschool, Infant

Background

The Dutch Growth Research Foundation (DGRF) (https://www.growthanalyser.org) claims that its commercial software products, Growth Analyser, document the growth and development of children “with ease”. However, details on the methods, interpretation of outcomes, and validation have not been published. The software assessment of (weight) growth at age t, called weight velocity (WV(t)), uses the weight gained over an interval of 1.23 years, or over the age itself if t <1.23 years (Eq. 1 of the Appendix), to distinguish normal from abnormal child development. Abnormal growth of young children, especially when an easy explanation is lacking, can greatly affect the quality of life of the child and the parents, e.g., when a caregiver is falsely accused of Pediatric Condition Falsification (PCF), a rare form of child abuse [1]. Therefore, their software could play a role in accurate growth assessment. However, evidence suggests that outcomes of a computerized system provide physicians with feelings of absolute certainty (see eg [2] and Discussion, second paragraph). This software should therefore be very accurate, transparent, and well tested before being marketed.

We previously showed that WV(t) provides seriously erroneous outcomes as a consequence of 2 concomitant issues [1]. First, the typical day-to-day fluctuations in the weights of young children cause corresponding fluctuations in weight velocity. Second, the very long age interval of 1.23 years used for WV(t) can cause any abrupt change in weight to propagate as a 1.23-year periodic series of “inverse-weight-velocity-echoes”, making WV(t) an exceedingly complex and nontransparent function of age [1]. In October 2019, a local Dutch Radio and TV Station in Utrecht summarized our findings journalistically on its website (https://www.rtvutrecht.nl/nieuws/1970056/, in Dutch). The DGRF replied that its commercial software output is not weight velocity but Weight Velocity for Age Standard Deviation Score (SDSWVA). The foundation sells this software exclusively to hospitals.

In the Appendix below we explain how the SDSWVA method was derived by the DGRF from the statistics-based Standard Deviation Score (notation SDS(t)), also called Z-score (see e.g. https://en.wikipedia.org/wiki/Standard_score). The SDSWVA includes WV(t) as well as weight velocities of standard weight curves, +1 SD, 0 SD and –1 SD, not at the same age t but at average age AA, halfway between t and (t−1.23) years. Thus, in children aged <1.23 years, AA=t/2 (Appendix, Eq. 3). The reason the DGRF chose this approach is not known. However, the greater precision of SDSWVA(t,AA) than of WV(t) outcomes may have been expected, because average age AA may compensate for the long period of 1.23 years used for WV(t). Nevertheless, WV(t) is still the key parameter in the DGRF software program, with all its complexities [1]. This paper was designed to show that the tacit expectation was not fulfilled.

Case Report

EARLIER:

The erroneous behavior of WV(t) was evident when applied to the weight curve of an infant boy [1]. Figure 1 shows his weight curve at 15 consecutive age periods (see Schematic Model below). Briefly [3], the boy was born at 39 gestational weeks as the sixth child of normal parents, weighting 3.18 kg. He was hospitalized for 2 weeks during age period 2 because of a slightly negative weight gain. Allergy to cows’ milk was suspected, with subsequent removal of cows’ milk from his diet resulted in a rapid weight gain (periods 3 and 4). Despite impressive weight growth, during periods 3–11 (age 0.33–2.4 years), which was 1.3- to 2.3-fold greater than the corresponding weight growth on the 0 SD standard weight curve, his first pediatrician stated in a legal summary of the second of 3 juvenile court hearings held in the boy’s case that “the boy does not grow” and ordered his mother to increase his food intake stepwise to 3.5 times normal (period 8) [3]. During period 8 (period 6 of [3]), the boy’s weight velocity was 2.1 times the 0 SD weight velocity. This pediatrician, as well as the second pediatrician, who was willing to confirm all the erroneous statements made by the first pediatrician during the second juvenile court hearing, appeared unable to distinguish (low) weight from (exceptional) weight growth [3]. Based on these reports, the mother was diagnosed with PCF and the boy was placed in foster care for 8.5 months.

CASE REPORT:

The present case begins during period 10, after the boy was in foster care for 2.5 months, at the time his third pediatrician was appointed. This pediatrician analyzed his weight growth with DGRF’s software SDSWVA(t,AA). This software confirmed the diagnosis of PCF, as explained in the second paragraph of the Discussion, which caused the boy to be continued in foster care for another 6 months. However, the report by this pediatrician contributed to the ending of foster care by another juvenile judge after 8.5 months.

SDS(t) and SDSSM(t,AA) were applied to 2 weight curves of this boy (Figure 1). The first weight curve (the clinical weights) was of the actual measured weights of the boy until age 3.1 years [1,3], whereas the second weight curve, the Schematic Model of his weights [1], replaced the individually measured weights with weights clustered in 15 consecutive age periods by least-squares fitting. The virtually linear increase in weight in all age periods gave 15 individual but accurate Period-Averaged-Weight-Velocities (Table 1 in [1], summarized in the caption to Figure 1). For comparison we also show the 0 SD standard weight curve.

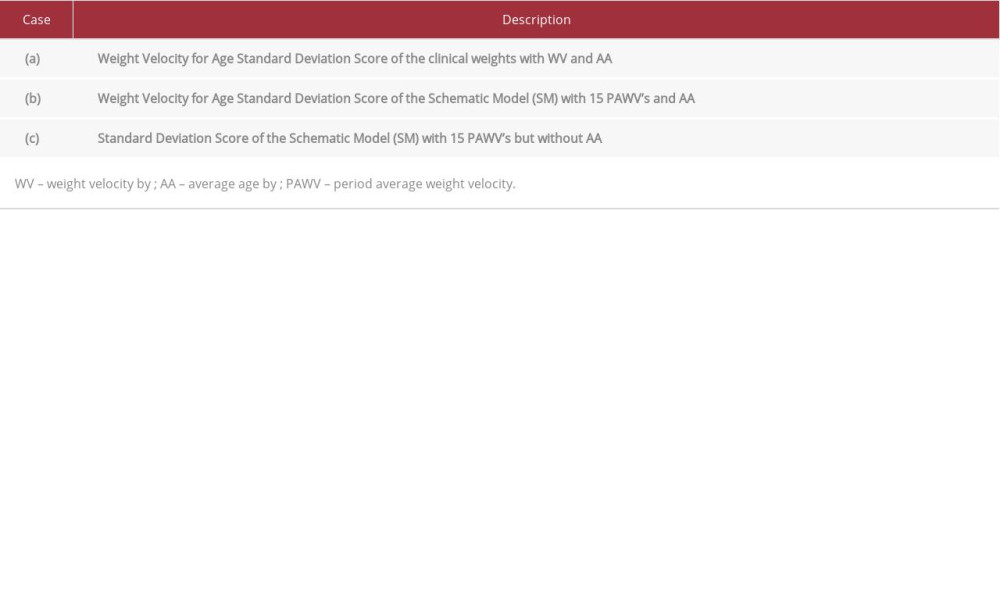
We calculated (a) SDSWVA(t,AA), the Weight Velocity for Age Standard Deviation Score of the boy’s clinical weights, and (b) SDSSM(t,AA), the Weight Velocity for Age Standard Deviation Score of the Schematic Model [1] with their exact Period-Averaged-Weight-Velocities, but including average age AA. We compared these 2 predictions with (c) SDSSM(t), the exact Standard Deviation Score of the Schematic Model with Period-Averaged-Weight-Velocities but without AA, here considered the standard for SDS-calculations, as these are arguably the most exact approximations of real weight growth velocity. The Table 1 summarizes the 3 case examples. This approach shows the effects on SDS-calculations of natural weight fluctuations, the 1.23 years of inter-weight age interval for WV, and the use of an average age AA.

Results

Figure 1 shows that, when the boy’s life became normal again, the 0 SD weight curve seemed to fit him well. Figure 2 (see Table 1 for descriptions) shows (a) SDSWVA(t,AA) of the clinical weights with WV and AA (dark blue open dots); (b) SDSSM(t,AA) of the schematic model with Period-Averaged-Weight-Velocities and AA (thin red dashed lines); and (c) SDSSM(t) of the schematic model with Period-Averaged-Weight-Velocities but without AA (solid red dashed lines), which served as the reference standard. The (dark blue) clinical case (a) basically duplicated all errors previously identified in the WV(t) curve [1], thus strongly underestimating values of about 2 SDS during period 8 (with bizarre prescribed food intake of 3.5 times normal [3]), and overestimating values of about 0.5 SDS during period 10 (with normal food intake while in foster care). Schematic Model case (b), with AA included, deviated less from the reference standard SDSSM(t), but still markedly underestimated weight gain during most periods, except for age periods 1, 2, and 12–15. The reference standard SDSSM(t) showed realistic trends during all periods. Interestingly, SDSSM(t) values during periods 1, 4, 6, 8, and 11, when the boy was at home, were up to 3 standard deviations greater than those of clinical case (a), SDSWVA(t,AA); but were somewhat lower when the boy was fed normal food while in foster care (period 10). The influence of AA can be inferred by comparing schematic model case (b), SDSSM(t,AA) with AA, and (c), SDSSM(t) without AA. The average age AA significantly reduced accuracy during most periods when compared with the best possible outcomes of SDSSM(t), although their relative behavior, such as between periods 8 and 10, remained correct.

Discussion

This study showed that the software package of the DGRF was severely limited when applied to an infant with an allergy to cows’ milk. The package does not provide possible limitations of the software. Without that knowledge, use of this type of software can be harmful for innocent young children.

The key finding of this study was that the Weight Velocity for Age Standard Deviation Score of the clinical weights did not provide greater accuracy, as tacitly suggested. Rather, this approach is at best equally erroneous as weight velocities, a finding that was not surprising in view of the significance of WV(t) for SDSWVA(t,AA) (Eq. 4 of the Appendix). Crucially, this software predicted that SDSWVA(t,AA) was much lower during period 8 than during period 10 rather than being much larger, similar to findings with WV(t) [1]. Because of these errors, the third pediatrician [3], unconditionally believing these software outcomes, supposed wrongly that the boy’s mother was starving him and uncritically confirmed the false accusation of PCF [3]. This software-based misdiagnosis lengthened the boy’s period in foster care by 6 months, from 2.5 to 8.5 months. To reduce the likelihood of recurrence of these family disasters, and because the DGRF does not provide warnings about possible erroneous outcomes, we strongly recommend that the DGRF provides an instruction manual that clearly describes the software output and interpretation, and includes a warning when this software should not be used.

Erroneous outcomes of SDSWVA(t,AA), relative to erroneous WV(t) predictions and due to natural weight fluctuations and the 1.23-year age interval, have been described [4]. Surprisingly, average age AA contributed to errors, as shown by comparing SDS outcomes of the Schematic Model with and without AA, i.e., cases (b) and (c) (Table 1). Further support comes from SDS-calculations (not shown) of the clinical weights, with WV (Eq. 1) but without AA, which provide SDS outcomes about 1 standard deviation closer to the reference standard, making it more accurate than case (a) itself, except during period 10. During that period, SDS values were around 2.5; the erroneous behavior during periods 8 and 10 was also retained. The problematic SDS outcomes in period 10 refer to the low weights prior to period 3, which occurred about 1.23 years prior to the high weights of period 10 and followed from the 3.5-fold overfeeding during period 9 and a bizarre weight increase. This resulted in exceedingly large WV(t)-values during period 10 [1]. Finally, precise relative SDS-behavior, such as in periods 8 and 10, requires more precise weight velocities than WV(t) of Eq. 1. Interestingly, we have reported that, against expectation, shortening of the 1.23-year age interval for WV(t) does not increase accuracy, as it is a consequence of the typical natural weight fluctuations in young children [4].

Additionally, we purchased version Growth Analyser EPRS 4.1.14 (Single User Edition). However, when applied to the child in this study, its SDSWVA(t,AA) outcomes exceeded their previous as well as our calculations from Eqs. 4 by about 1 standard deviation. The foundation indeed identified a software error in the assessment of average age AA and offered the corrected version Growth Analyser EPRS 4.1.15 (Single User Edition). We believe that selling untested software versions harms the foundation’s credibility.

Conclusions

The SDSWVA(t,AA) retailed weight growth software is erroneous, untransparent, and may be untested. Inaccuracy is due to the combined effects of natural clinical weight fluctuations, the long 1.23-year period used for WV(t), and the use of an average age AA. This software should not be used to monitor weight growth of children under 3 years of age or in children with wide weight fluctuations, irrespective of age. Unreliable software performance, the absence of published details on methods, interpretation and validation, and issues of credibility suggest that the Dutch Growth Research Foundation may be unable to continue commercial activities, especially in regard to the new European Union regulations for in vitro medical devices [4].

Figures

Clinical weights (blue open circles) [1,3]; Schematic Model weight curve with 15 consecutive age periods (red points), age periods indicated with blue labels on horizontal axis [1]; and 0 SD standard weight curve (black line) [5]. Each age period and corresponding Period-Averaged-Weight-Velocity (period; PAWV in kg/year) are: (1;5.7), (2;–1.14), (3;17.1), (4;5.5), (5;–9.5), (6;7.5), (7;–25.5), (8;6.2), (9;45.0), (10;3.55), (11;5.12), (12;–1.31), (13;1.02), (14;10.6), and (15;1.36).Figure 1.. Clinical weights (blue open circles) [1,3]; Schematic Model weight curve with 15 consecutive age periods (red points), age periods indicated with blue labels on horizontal axis [1]; and 0 SD standard weight curve (black line) [5]. Each age period and corresponding Period-Averaged-Weight-Velocity (period; PAWV in kg/year) are: (1;5.7), (2;–1.14), (3;17.1), (4;5.5), (5;–9.5), (6;7.5), (7;–25.5), (8;6.2), (9;45.0), (10;3.55), (11;5.12), (12;–1.31), (13;1.02), (14;10.6), and (15;1.36). (a)SDSWVA(t,AA), Weight Velocity for Age Standard Deviation Score of the clinical weights (blue dots); (b) SDSSM(t,AA), Weight Velocity for Age Standard Deviation Score of the Schematic Model, with average age AA included but using the Period-Averaged-Weight-Velocity for each of the 15 periods (red dashed lines); and (c) SDSSM(t) of the Schematic Model using the Period-Averaged-Weight-Velocity for each of the 15 periods but not AA as the reference standard (solid red dashed lines). The Table 1 summarizes the description of the 3 cases.Figure 2.. (a)SDSWVA(t,AA), Weight Velocity for Age Standard Deviation Score of the clinical weights (blue dots); (b) SDSSM(t,AA), Weight Velocity for Age Standard Deviation Score of the Schematic Model, with average age AA included but using the Period-Averaged-Weight-Velocity for each of the 15 periods (red dashed lines); and (c) SDSSM(t) of the Schematic Model using the Period-Averaged-Weight-Velocity for each of the 15 periods but not AA as the reference standard (solid red dashed lines). The Table 1 summarizes the description of the 3 cases. Weight Velocities of the +1 SD, 0 SD and −1 SD standard weight curves for Dutch boys [5]. The weight velocity data point at t1=1.42 years was set at WV(t1)=7 kg/year. In the first example (red lines below/right), the Standard Deviation Score at age t1 was SDS(t1=1.42)=X/Y=3.5 (Eq. 2a), indicating that the weight velocity at t1=1.42 years was 3.5 Standard Deviations above the mean of the data set, the 0 SD weight velocity at age t1. In the second example (red dashed lines middle), the SDSWVA(t1,AA)=A/B=1.56 (Eq. 4a), with the weight velocity at age t1=1.42 years being 1.56 Standard Deviations above the mean of the data set, the 0 SD weight velocity at average age AA=0.805 years.Figure 3.. Weight Velocities of the +1 SD, 0 SD and −1 SD standard weight curves for Dutch boys [5]. The weight velocity data point at t1=1.42 years was set at WV(t1)=7 kg/year. In the first example (red lines below/right), the Standard Deviation Score at age t1 was SDS(t1=1.42)=X/Y=3.5 (Eq. 2a), indicating that the weight velocity at t1=1.42 years was 3.5 Standard Deviations above the mean of the data set, the 0 SD weight velocity at age t1. In the second example (red dashed lines middle), the SDSWVA(t1,AA)=A/B=1.56 (Eq. 4a), with the weight velocity at age t1=1.42 years being 1.56 Standard Deviations above the mean of the data set, the 0 SD weight velocity at average age AA=0.805 years.

References:

1.. van Gemert MJC, Bruijninckx CMA, van Leeuwen TG, Limitations of weight velocity analysis by commercial computer program Growth Analyser Viewer Edition: Ann Biomed Eng, 2019; 47(1); 297-305

2.. Ernst M, Bernhardt M, Bechstein M, Performance of semiautomatic assessment of carotid artery stenosis on CT angiography: Clarification of differences with manual assessment. Effect of CAD on performance in ASPECTS reading: Inform Med Unlocked, 2020; 18; 100295

3.. van Gemert MJC, Vlaming M, Osinga E, Pediatric condition falsification misdiagnosed by misjudged weight growth from the curve of measured weights: Am J Case Rep, 2018; 19; 752-56

4.. van Gemert MJC, Bruijninckx CMA, Neumann HAM, Weight velocity equations with 14–448 days time separated weights should not be used for infants under 3 years of age: Med Hypotheses, 2019; 129; 109234

5.. Gerver WJM, de Bruin R: Paediatric morphometrics, 2001, Maastricht, University Press Maastricht

Figures

Figure 1.. Clinical weights (blue open circles) [1,3]; Schematic Model weight curve with 15 consecutive age periods (red points), age periods indicated with blue labels on horizontal axis [1]; and 0 SD standard weight curve (black line) [5]. Each age period and corresponding Period-Averaged-Weight-Velocity (period; PAWV in kg/year) are: (1;5.7), (2;–1.14), (3;17.1), (4;5.5), (5;–9.5), (6;7.5), (7;–25.5), (8;6.2), (9;45.0), (10;3.55), (11;5.12), (12;–1.31), (13;1.02), (14;10.6), and (15;1.36).Figure 2.. (a)SDSWVA(t,AA), Weight Velocity for Age Standard Deviation Score of the clinical weights (blue dots); (b) SDSSM(t,AA), Weight Velocity for Age Standard Deviation Score of the Schematic Model, with average age AA included but using the Period-Averaged-Weight-Velocity for each of the 15 periods (red dashed lines); and (c) SDSSM(t) of the Schematic Model using the Period-Averaged-Weight-Velocity for each of the 15 periods but not AA as the reference standard (solid red dashed lines). The Table 1 summarizes the description of the 3 cases.Figure 3.. Weight Velocities of the +1 SD, 0 SD and −1 SD standard weight curves for Dutch boys [5]. The weight velocity data point at t1=1.42 years was set at WV(t1)=7 kg/year. In the first example (red lines below/right), the Standard Deviation Score at age t1 was SDS(t1=1.42)=X/Y=3.5 (Eq. 2a), indicating that the weight velocity at t1=1.42 years was 3.5 Standard Deviations above the mean of the data set, the 0 SD weight velocity at age t1. In the second example (red dashed lines middle), the SDSWVA(t1,AA)=A/B=1.56 (Eq. 4a), with the weight velocity at age t1=1.42 years being 1.56 Standard Deviations above the mean of the data set, the 0 SD weight velocity at average age AA=0.805 years.

In Press

12 Feb 2024 : Case report  Germany

Diagnostic Challenges and Imaging Considerations for Intraparotid Facial Nerve Schwannoma: A Case Report an...

Am J Case Rep In Press; DOI: 10.12659/AJCR.942870  

0:00

12 Feb 2024 : Case report  USA

Erdheim-Chester Disease Occult on Radiographs and CT but Visible on MRI and PET

Am J Case Rep In Press; DOI: 10.12659/AJCR.941169  

0:00

12 Feb 2024 : Case report  USA

Surgical Treatment of Spontaneous Superficial Temporal Artery Arteriovenous Malformation: A Case Report

Am J Case Rep In Press; DOI: 10.12659/AJCR.942839  

13 Feb 2024 : Case report  Bahrain

Warfarin Woes: A Rare Case of Hemoperitoneum with Intramural Small Bowel Hematoma

Am J Case Rep In Press; DOI: 10.12659/AJCR.943519  

Most Viewed Current Articles

10 Jan 2022 : Case report  Germany

A Report on the First 7 Sequential Patients Treated Within the C-Reactive Protein Apheresis in COVID (CACOV...

DOI :10.12659/AJCR.935263

Am J Case Rep 2022; 23:e935263

19 Jul 2022 : Case report  Saudi Arabia

Atlantoaxial Subluxation Secondary to SARS-CoV-2 Infection: A Rare Orthopedic Complication from COVID-19

DOI :10.12659/AJCR.936128

Am J Case Rep 2022; 23:e936128

05 Mar 2022 : Case report  Brazil

Acute Limb Ischemia After Self-Injection of Crushed Morphine Tablets into the Radial Artery: Role of Infrar...

DOI :10.12659/AJCR.935336

Am J Case Rep 2022; 23:e935336

02 Apr 2022 : Case report  Saudi Arabia

Infective Endocarditis Caused by Pseudomonas luteola in a Pediatric Patient. A Case Report and Review of Li...

DOI :10.12659/AJCR.935743

Am J Case Rep 2022; 23:e935743

Your Privacy

We use cookies to ensure the functionality of our website, to personalize content and advertising, to provide social media features, and to analyze our traffic. If you allow us to do so, we also inform our social media, advertising and analysis partners about your use of our website, You can decise for yourself which categories you you want to deny or allow. Please note that based on your settings not all functionalities of the site are available. View our privacy policy.

American Journal of Case Reports eISSN: 1941-5923